* Init quickstart

* Switch to dbengine

* Init new files

* Init new files

* Finish with reference

* Add descriptions

* Restore existing /streaming/README.md to original

* Reconfigure settings per Thiago's feedback

* Fixes for Vlad

* Fix typo

* Add optional TLS/SSL section

* Add link to SSL options
92 lines
5.1 KiB
Plaintext
92 lines
5.1 KiB
Plaintext
---
|
|
title: "How metrics streaming works"
|
|
description: "Netdata's real-time streaming allows you to replicate metrics data across multiple nodes, or centralize all your metrics data into a single time-series database (TSDB)."
|
|
type: explanation
|
|
custom_edit_url: https://github.com/netdata/netdata/edit/master/docs/metrics-storage-management/how-streaming-works.mdx
|
|
---
|
|
|
|
# How metrics streaming works
|
|
|
|
Each node running Netdata can stream the metrics it collects, in real time, to another node. Streaming allows you to
|
|
replicate metrics data across multiple nodes, or centralize all your metrics data into a single time-series database
|
|
(TSDB).
|
|
|
|
When one node streams metrics to another, the node receiving metrics can visualize them on the
|
|
[dashboard](/docs/visualize/interact-dashboards-charts.md), run health checks to [trigger
|
|
alarms](/docs/monitor/view-active-alarms.md) and [send notifications](/docs/monitor/enable-notifications.md), and
|
|
[export](/docs/export/external-databases.md) all metrics to an external TSDB. When Netdata streams metrics to another
|
|
Netdata, the receiving one is able to perform everything a Netdata instance is capable of.
|
|
|
|
Streaming lets you decide exactly how you want to store and maintain metrics data. While we believe Netdata's
|
|
[distributed architecture](/docs/store/distributed-data-architecture.md) is ideal for speed and scale, streaming
|
|
provides centralization options for those who want to maintain only a single TSDB instance.
|
|
|
|
## Streaming basics
|
|
|
|
There are three types of nodes in Netdata's streaming ecosystem.
|
|
|
|
- **Parent**: A node, running Netdata, that receives streamed metric data.
|
|
- **Child**: A node, running Netdata, that streams metric data to one or more parent.
|
|
- **Proxy**: A node, running Netdata, that receives metric data from a child and "forwards" them on to a
|
|
separate parent node.
|
|
|
|
Netdata uses API keys, which are just random GUIDs, to authorize the communication between child and parent nodes. We
|
|
recommend using `uuidgen` for generating API keys, which can then be used across any number of streaming connections.
|
|
Or, you can generate unique API keys for each parent-child relationship.
|
|
|
|
Once the parent node authorizes the child's API key, the child can start streaming metrics.
|
|
|
|
It's important to note that the streaming connection uses TCP, UDP, or Unix sockets, _not HTTP_. To proxy streaming
|
|
metrics, you need to use a proxy that tunnels [OSI layer 4-7
|
|
traffic](https://en.wikipedia.org/wiki/OSI_model#Layer_4:_Transport_Layer) without interfering with it, such as
|
|
[SOCKS](https://en.wikipedia.org/wiki/SOCKS) or Nginx's [TCP/UDP load
|
|
balancing](https://docs.nginx.com/nginx/admin-guide/load-balancer/tcp-udp-load-balancer/).
|
|
|
|
## Supported streaming configurations
|
|
|
|
Netdata supports any combination of parent, child, and proxy nodes that you can imagine. Any node can act as both a
|
|
parent, child, or proxy at the same time, sending or receiving streaming metrics from any number of other nodes.
|
|
|
|
Here are a few example streaming configurations:
|
|
|
|
- **Headless collector**:
|
|
- Child `A`, _without_ a database or web dashboard, streams metrics to parent `B`.
|
|
- `A` metrics are only available via the local Agent dashboard for `B`.
|
|
- `B` generates alarms for `A`.
|
|
- **Replication**:
|
|
- Child `A`, _with_ a database and web dashboard, streams metrics to parent `B`.
|
|
- `A` metrics are available on both local Agent dashboards, and can be stored with the same or different metrics
|
|
retention policies.
|
|
- Both `A` and `B` generate alarms.
|
|
- **Proxy**:
|
|
- Child `A`, _with or without_ a database, sends metrics to proxy `C`, also _with or without_ a database. `C` sends
|
|
metrics to parent `B`.
|
|
- Any node with a database can generate alarms.
|
|
|
|
## Viewing streamed metrics
|
|
|
|
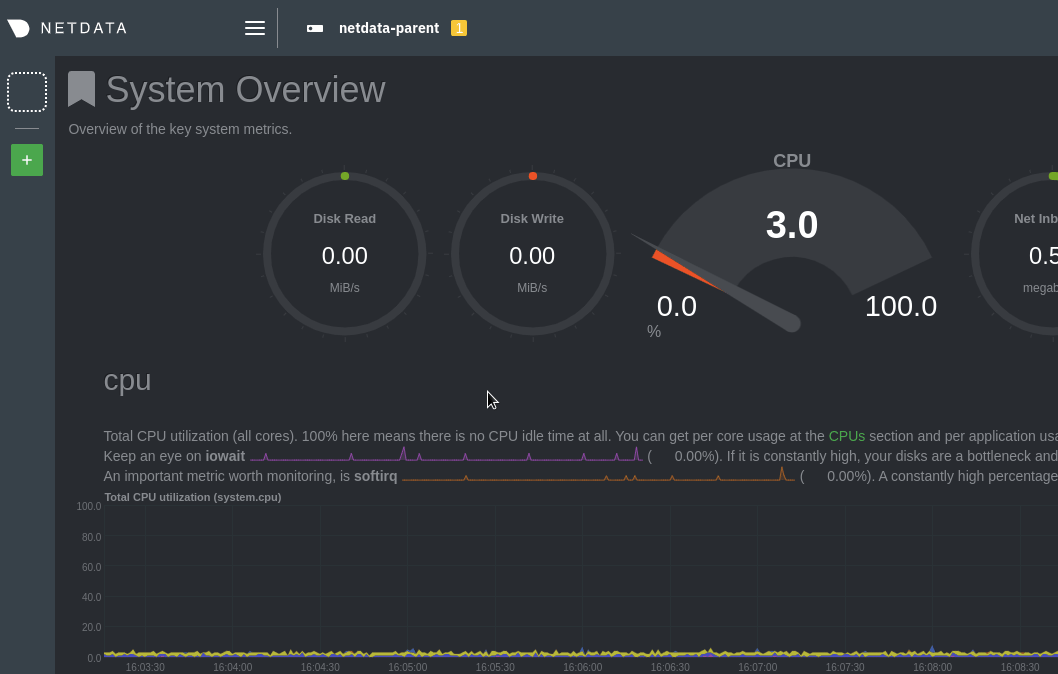
Parent nodes feature a **Replicated Nodes** section in the left-hand panel, which opens with the hamburger icon
|
|

|
|
in the top navigation. The parent node, plus any child nodes, appear here. Click on any of the hostnames to switch
|
|
between parent and child dashboards, all served by the parent's [web server](/web/server/README.md).
|
|
|
|
|
|
|
|
Each child dashboard is also available directly at the following URL pattern:
|
|
`http://PARENT-NODE:19999/host/CHILD-HOSTNAME`.
|
|
|
|
## What's next?
|
|
|
|
Now that you understand the fundamentals of streaming metrics between nodes, go ahead and [enable
|
|
streaming](/docs/metrics-storage-management/enable-streaming.mdx) using a simple `parent-child` relationship. For all
|
|
the details, see the [streaming reference](/docs/metrics-storage-management/reference-streaming.mdx) doc.
|
|
|
|
Take your streaming setup even further by [exporting metrics](/docs/export/external-databases.md) to an external TSDB.
|
|
|
|
### Related information & further reading
|
|
|
|
- Streaming
|
|
- **[How Netdata streams metrics](/docs/metrics-storage-management/how-streaming-works.mdx)**
|
|
- [Enable streaming between nodes](/docs/metrics-storage-management/enable-streaming.mdx)
|
|
- [Streaming reference](/docs/metrics-storage-management/reference-streaming.mdx) |