126 lines
5.7 KiB
Markdown
126 lines
5.7 KiB
Markdown
---
|
|
title: "Unsupervised anomaly detection for Raspberry Pi monitoring"
|
|
description: "Use a low-overhead machine learning algorithm and an open-source monitoring tool to detect anomalous metrics on a Raspberry Pi."
|
|
image: /img/seo/guides/monitor/raspberry-pi-anomaly-detection.png
|
|
author: "Andy Maguire"
|
|
author_title: "Senior Machine Learning Engineer"
|
|
author_img: "/img/authors/andy-maguire.jpg"
|
|
custom_edit_url: https://github.com/netdata/netdata/edit/master/docs/guides/monitor/raspberry-pi-anomaly-detection.md
|
|
---
|
|
|
|
We love IoT and edge at Netdata, we also love machine learning. Even better if we can combine the two to ease the pain
|
|
of monitoring increasingly complex systems.
|
|
|
|
We recently explored what might be involved in enabling our Python-based [anomalies
|
|
collector](/collectors/python.d.plugin/anomalies/README.md) on a Raspberry Pi. To our delight, it's actually quite
|
|
straightforward!
|
|
|
|
Read on to learn all the steps and enable unsupervised anomaly detection on your on Raspberry Pi(s).
|
|
|
|
> Spoiler: It's just a couple of extra commands that will make you feel like a pro.
|
|
|
|
## What you need to get started
|
|
|
|
- A Raspberry Pi running Raspbian, which we'll call a _node_.
|
|
- The [open-source Netdata](https://github.com/netdata/netdata) monitoring agent. If you don't have it installed on your
|
|
node yet, [get started now](/docs/get-started.mdx).
|
|
|
|
## Install dependencies
|
|
|
|
First make sure Netdata is using Python 3 when it runs Python-based data collectors.
|
|
|
|
Next, open `netdata.conf` using [`edit-config`](/docs/configure/nodes.md#use-edit-config-to-edit-configuration-files)
|
|
from within the [Netdata config directory](/docs/configure/nodes.md#the-netdata-config-directory). Scroll down to the
|
|
`[plugin:python.d]` section to pass in the `-ppython3` command option.
|
|
|
|
```conf
|
|
[plugin:python.d]
|
|
# update every = 1
|
|
command options = -ppython3
|
|
```
|
|
|
|
Next, install some of the underlying libraries used by the Python packages the collector depends upon.
|
|
|
|
```bash
|
|
sudo apt install llvm-9 libatlas3-base libgfortran5 libatlas-base-dev
|
|
```
|
|
|
|
Now you're ready to install the Python packages used by the collector itself. First, become the `netdata` user.
|
|
|
|
```bash
|
|
sudo su -s /bin/bash netdata
|
|
```
|
|
|
|
Then pass in the location to find `llvm` as an environment variable for `pip3`.
|
|
|
|
```bash
|
|
LLVM_CONFIG=llvm-config-9 pip3 install --user llvmlite numpy==1.20.1 netdata-pandas==0.0.38 numba==0.50.1 scikit-learn==0.23.2 pyod==0.8.3
|
|
```
|
|
|
|
## Enable the anomalies collector
|
|
|
|
Now you're ready to enable the collector and [restart Netdata](/docs/configure/start-stop-restart.md).
|
|
|
|
```bash
|
|
sudo ./edit-config python.d.conf
|
|
# set `anomalies: no` to `anomalies: yes`
|
|
|
|
# restart netdata
|
|
sudo systemctl restart netdata
|
|
```
|
|
|
|
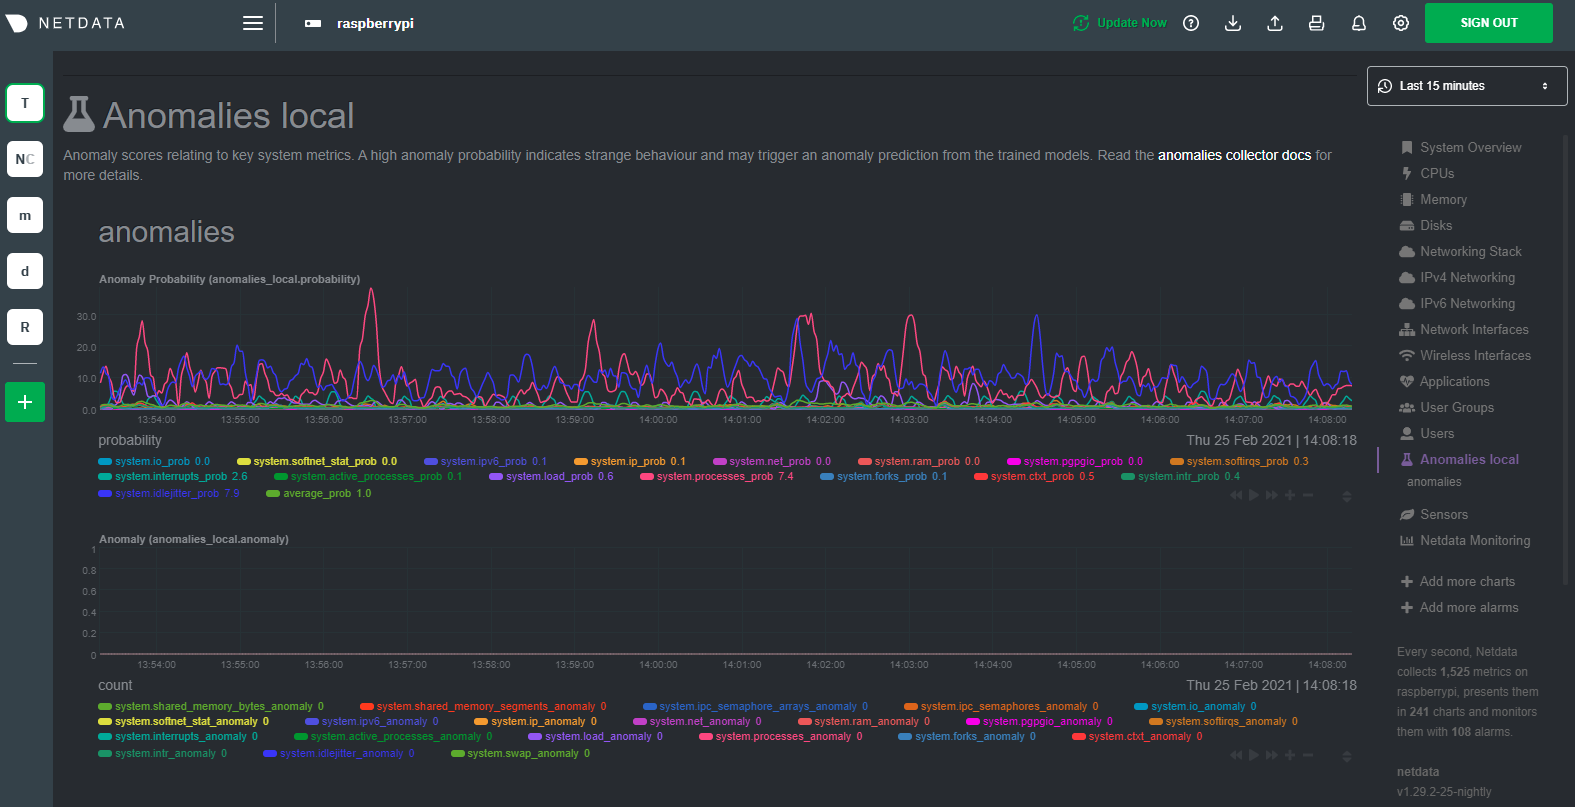
And that should be it! Wait a minute or two, refresh your Netdata dashboard, you should see the default anomalies
|
|
charts under the **Anomalies** section in the dashboard's menu.
|
|
|
|
|
|
|
|
## Overhead on system
|
|
|
|
Of course one of the most important considerations when trying to do anomaly detection at the edge (as opposed to in a
|
|
centralized cloud somewhere) is the resource utilization impact of running a monitoring tool.
|
|
|
|
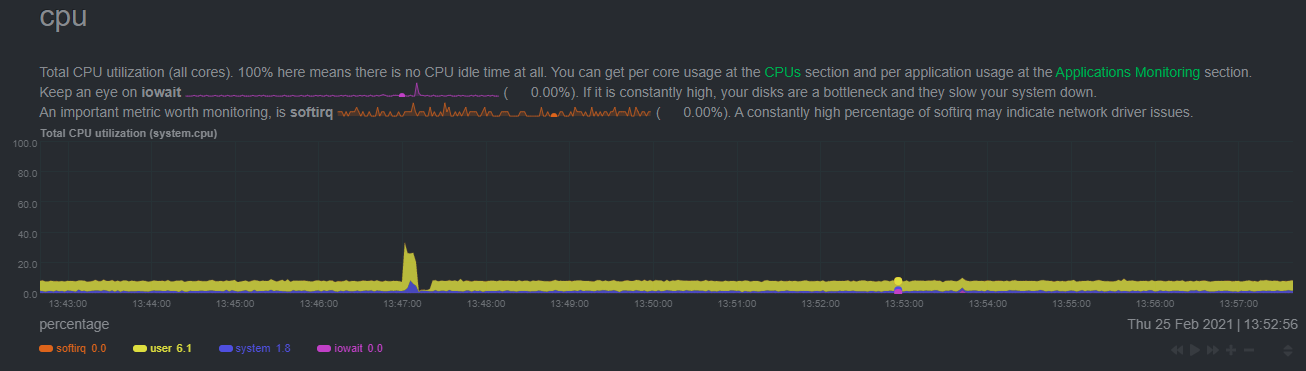
With the default configuration, the anomalies collector uses about 6.5% of CPU at each run. During the retraining step,
|
|
CPU utilization jumps to between 20-30% for a few seconds, but you can [configure
|
|
retraining](/collectors/python.d.plugin/anomalies/README.md#configuration) to happen less often if you wish.
|
|
|
|
|
|
|
|
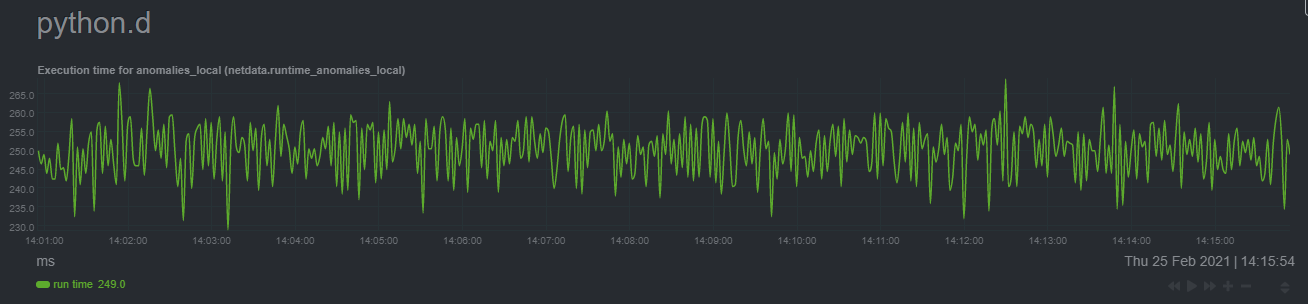
In terms of the runtime of the collector, it was averaging around 250ms during each prediction step, jumping to about
|
|
8-10 seconds during a retraining step. This jump equates only to a small gap in the anomaly charts for a few seconds.
|
|
|
|
|
|
|
|
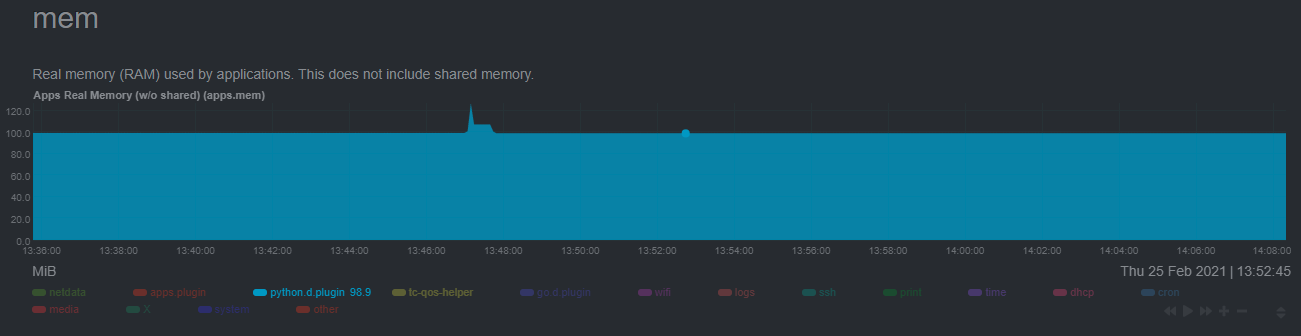
The last consideration then is the amount of RAM the collector needs to store both the models and some of the data
|
|
during training. By default, the anomalies collector, along with all other running Python-based collectors, uses about
|
|
100MB of system memory.
|
|
|
|
|
|
|
|
## What's next?
|
|
|
|
So, all in all, with a small little bit of extra set up and a small overhead on the Pi itself, the anomalies collector
|
|
looks like a potentially useful addition to enable unsupervised anomaly detection on your Pi.
|
|
|
|
See our two-part guide series for a more complete picture of configuring the anomalies collector, plus some best
|
|
practices on using the charts it automatically generates:
|
|
|
|
- [_Detect anomalies in systems and applications_](/docs/guides/monitor/anomaly-detection-python.md)
|
|
- [_Monitor and visualize anomalies with Netdata_](/docs/guides/monitor/visualize-monitor-anomalies.md)
|
|
|
|
If you're using your Raspberry Pi for other purposes, like blocking ads/trackers with Pi-hole, check out our companions
|
|
Pi guide: [_Monitor Pi-hole (and a Raspberry Pi) with Netdata_](/docs/guides/monitor/pi-hole-raspberry-pi.md).
|
|
|
|
Once you've had a chance to give unsupervised anomaly detection a go, share your use cases and let us know of any
|
|
feedback on our [community forum](https://community.netdata.cloud/t/anomalies-collector-feedback-megathread/767).
|
|
|
|
### Related reference documentation
|
|
|
|
- [Netdata Agent · Get Netdata](/docs/get-started.mdx)
|
|
- [Netdata Agent · Anomalies collector](/collectors/python.d.plugin/anomalies/README.md)
|
|
|
|
|